Matplotlib 실시간 차트 그리기
이번 시간에는 matplotlib를 이용해 실시간 챠트(FuncAnimation이용)를
구성하는 방법과 해당 챠트를 PyQt5와 연동하는 방법에 대해 소개합니다.
인터넷에 matplotlib를 이용해 챠트를 그리는 방법은 많이 소개되어 있지만, 실시간 챠트 예제는 자료가 거의 없어 직접 만들어 보았습니다.
썬 패키지 입니다.


먼저 1~7번 라인에서 필요한 모듈을 불러옵니다. (matplotlib, pyqt5, numpy 등)
9번 라인은 4k 모니터를 위한 Qt 고해상도 설정 코드입니다.
11번 라인부터 QWidget에서 상속받은 CWidget class 선언이 시작됩니다.
13~22번 라인, CWidget의 생성자 함수로 matplotlib의 Figure 객체를 생성하고 PyQt5에 챠트를 붙이기 위한 FigureCanvasQTAgg 객체도 생성합니다.
좀 더 자세히 설명하자면, Figure 객체는 plot 의 모든 요소 중 최상위 객체이며, FigureCanvasQTAgg는 차후 Qt의 Widget(일종의 윈도우 창)에 붙어 보여(그려)지게 됩니다.
timeInterval은 나중에 챠트를 계속 이어 그려가게 되므로 sin 파의 시간 (x축) 간격을 의미합니다.
이어서 self.x 리스트를 0부터 2파이 까지 0.1(timeInterval) 간격으로 x축 numpy 리스트(배열) 를 생성합니다.

self.y는 y축의 데이터를 리스트한 배열로 sin(self.x, 라디안)의 값이 리스트로 저장됩니다.

27~43번 라인의 initUI() 함수는 생성자에서 호출되는 함수로, 생성자함수(__init__)에서 객체 변수와 관계된 코드를 작성했다면 여기서는 UI와 관계된 초기화를 수행하도록 합니다.
PyQt의 수직 레이아웃 박스를 만들고 addWidget() 함수를 이용해 생성자에서 만든 canvas 객체를 추가합니다.
Qt의 레이아웃 박스는 윈도우의 크기가 변경되면 배치된 컨트롤 위젯의 크기를 자동으로 조절해 리사이즈를 편리하게 도와줍니다.
이어서 CWidget의 setLayout() 함수를 통해 챠트가 추가된 canvas를 메인 윈도우에 배치합니다.
35번 라인 Figure 객체를 이용해 서브 챠트 그래프축(Axes)을 생성하는데, (1, 1, 1) 의 의미는 1부터 1까지 챠트 중 1번째라는 뜻입니다. 즉 하나만 만든다는 의미죠.
37번 라인은 해당 축에 x, y 데이터 리스트를 전달해 생성하고 Line2D(self.line) 객체를 생성합니다. 특이한 점은 Line2D 객체를 리턴 받을때 'self.line, = ' 쉼표가 들어가 있는데 이는 여러개의 Line2D 객체를 전달받을 수 있도록 리스트를 리턴하기 때문입니다.
42번 라인이 이 코드의 핵심인 FuncAnimation 클래스 객체를 생성하는 부분입니다. 바로 이 클래스가 실시간(애니메이션) 챠트를 구성하도록 합니다.
이 클래스의 생성자의 전달인자는 아주 복잡해서 matplotlib의 문서를 인용해 설명해 보겠습니다.
먼저 FuncAnimation 클래스 생성자의 모습입니다.
class
다음은 생성자 함수의 전달인자에 대한 설명입니다.
이상이 FuncAnimation Class의 설명인데, 저는 초기화, 콜백 함수를 설정하고 간격은 약 100ms로 설정하였습니다.
이제 설정을 마치고 canvas.draw() 함수를 이용해 챠트를 그리고, self.show() 함수를 이용해 Qt Widget을 띄웁니다.
이제 45번 라인 initPlot() 함수가 호출되고 생성자에서 만들어둔 numpy 배열 self.y를 이용해 plot의 Y축을 초기화 합니다.
이 함수는 FuncAnimation 클래스 생성 시 inut_func로 등록해 둔 함수이며, 애니메이션 프레임을 갱신전 한번만 호출됩니다.
마지막으로 49번 라인 animate() 함수는 매 100ms 마다 호출되며, 챠트 Y축 값에 timeInterval (0.1) 을 더한 sin 그래프를 그려가게 됩니다.
이상으로 코드 분석을 마칩니다.
감사합니다.
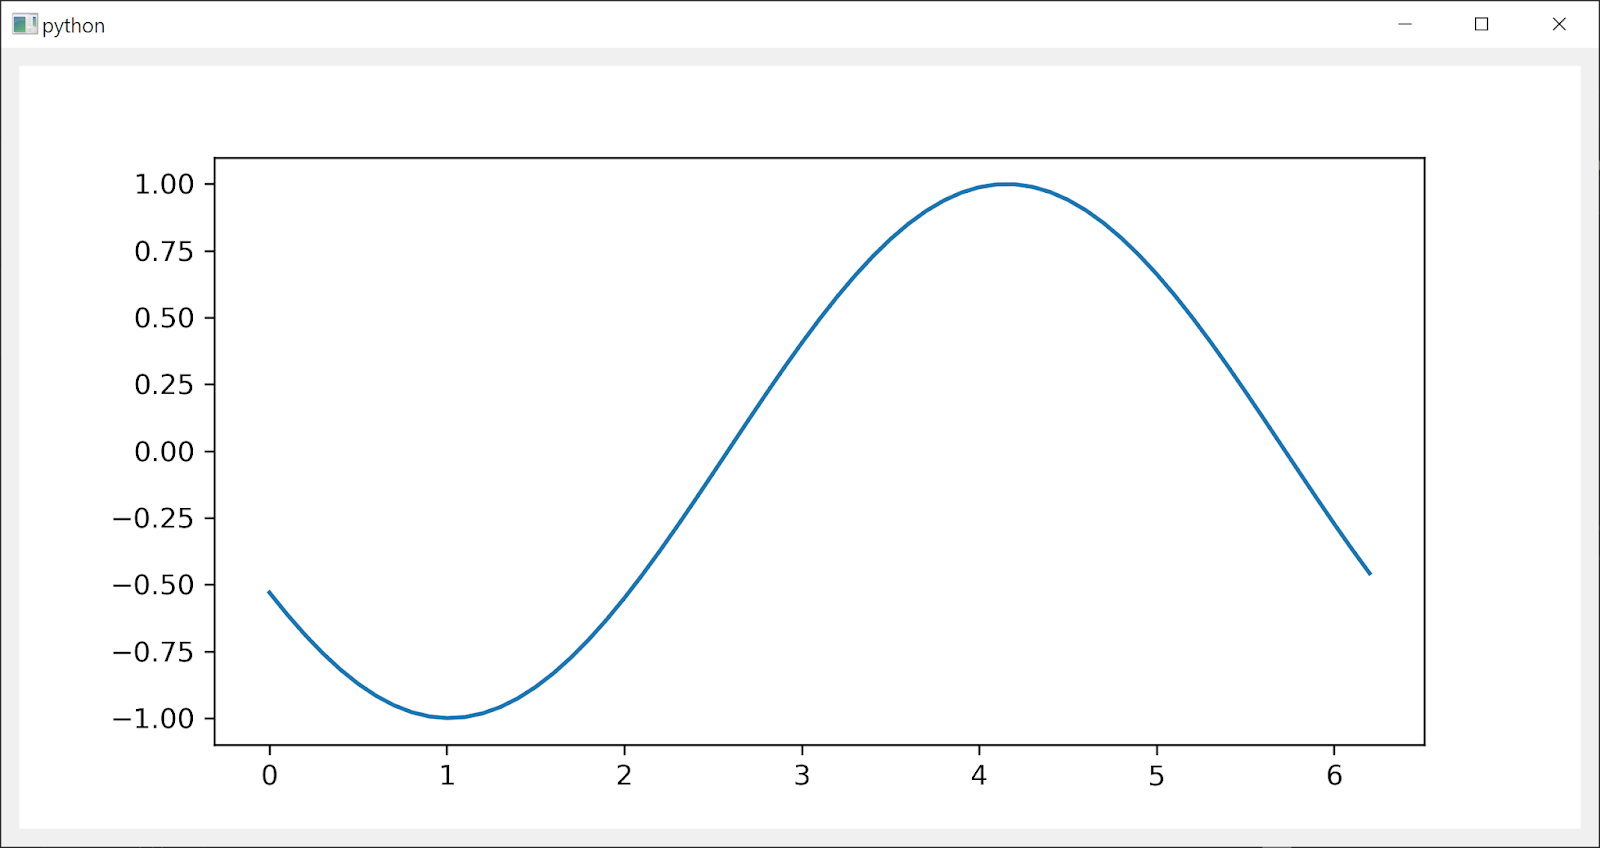
- sin 파 FuncAnimation Class를 이용해 실시간으로 그리기
|
| [matplotlib + PyQt5 + FuncAnimation] |
인터넷에 matplotlib를 이용해 챠트를 그리는 방법은 많이 소개되어 있지만, 실시간 챠트 예제는 자료가 거의 없어 직접 만들어 보았습니다.
- Pyinstaller로 제작한 실행파일 : chart
matplotlib 예시
matplotlib는 데이터를 여러 종류 챠트를 구성하고, 보기좋게 그래프로 시각화 시키는 파이썬 패키지 입니다.
소스코드
import sys
from PyQt5.QtCore import Qt
from PyQt5.QtWidgets import QApplication, QWidget, QVBoxLayout
import matplotlib.pyplot as plt
import matplotlib.animation as animation
from matplotlib.backends.backend_qt5agg import FigureCanvasQTAgg
import numpy as np

QApplication.setAttribute(Qt.AA_EnableHighDpiScaling, True)

class CWidget(QWidget):

    def __init__(self):
        super().__init__()
        # for PyQt embedding
        self.fig = plt.Figure()
        self.canvas = FigureCanvasQTAgg(self.fig)

        self.timeInterval = 0.1

        self.x = np.arange(0, 2*np.pi, self.timeInterval)
        self.y = np.sin(self.x)


        self.initUI()

    def initUI(self):
        vbox = QVBoxLayout()
        vbox.addWidget(self.canvas)

        self.setLayout(vbox)
        self.setGeometry(0,0,800,400)

        # 1~1 중 1번째(1,1,1)  서브 챠트 생성
        self.ax = self.fig.add_subplot(1,1,1)
        # 2D line
        self.line, = self.ax.plot(self.x, self.y)

        # 애니메이션 챠트 생성
        self.ani = animation.FuncAnimation(self.fig, self.animate, init_func=self.initPlot, interval=100, blit=False, save_count=50)
        self.canvas.draw()

        self.show()

    def initPlot(self):
        self.line.set_ydata([np.nan]*len(self.x))
        return self.line,

    def animate(self, i):
        self.line.set_ydata(np.sin(self.x + i * self.timeInterval))
        return self.line,

    def closeEvent(self, e):
        pass


if __name__ == '__main__':
    app = QApplication(sys.argv)
    w = CWidget()
    sys.exit(app.exec_())
먼저 1~7번 라인에서 필요한 모듈을 불러옵니다. (matplotlib, pyqt5, numpy 등)
9번 라인은 4k 모니터를 위한 Qt 고해상도 설정 코드입니다.
11번 라인부터 QWidget에서 상속받은 CWidget class 선언이 시작됩니다.
13~22번 라인, CWidget의 생성자 함수로 matplotlib의 Figure 객체를 생성하고 PyQt5에 챠트를 붙이기 위한 FigureCanvasQTAgg 객체도 생성합니다.
좀 더 자세히 설명하자면, Figure 객체는 plot 의 모든 요소 중 최상위 객체이며, FigureCanvasQTAgg는 차후 Qt의 Widget(일종의 윈도우 창)에 붙어 보여(그려)지게 됩니다.
timeInterval은 나중에 챠트를 계속 이어 그려가게 되므로 sin 파의 시간 (x축) 간격을 의미합니다.
이어서 self.x 리스트를 0부터 2파이 까지 0.1(timeInterval) 간격으로 x축 numpy 리스트(배열) 를 생성합니다.
self.y는 y축의 데이터를 리스트한 배열로 sin(self.x, 라디안)의 값이 리스트로 저장됩니다.
27~43번 라인의 initUI() 함수는 생성자에서 호출되는 함수로, 생성자함수(__init__)에서 객체 변수와 관계된 코드를 작성했다면 여기서는 UI와 관계된 초기화를 수행하도록 합니다.
PyQt의 수직 레이아웃 박스를 만들고 addWidget() 함수를 이용해 생성자에서 만든 canvas 객체를 추가합니다.
Qt의 레이아웃 박스는 윈도우의 크기가 변경되면 배치된 컨트롤 위젯의 크기를 자동으로 조절해 리사이즈를 편리하게 도와줍니다.
이어서 CWidget의 setLayout() 함수를 통해 챠트가 추가된 canvas를 메인 윈도우에 배치합니다.
35번 라인 Figure 객체를 이용해 서브 챠트 그래프축(Axes)을 생성하는데, (1, 1, 1) 의 의미는 1부터 1까지 챠트 중 1번째라는 뜻입니다. 즉 하나만 만든다는 의미죠.
37번 라인은 해당 축에 x, y 데이터 리스트를 전달해 생성하고 Line2D(self.line) 객체를 생성합니다. 특이한 점은 Line2D 객체를 리턴 받을때 'self.line, = ' 쉼표가 들어가 있는데 이는 여러개의 Line2D 객체를 전달받을 수 있도록 리스트를 리턴하기 때문입니다.
42번 라인이 이 코드의 핵심인 FuncAnimation 클래스 객체를 생성하는 부분입니다. 바로 이 클래스가 실시간(애니메이션) 챠트를 구성하도록 합니다.
이 클래스의 생성자의 전달인자는 아주 복잡해서 matplotlib의 문서를 인용해 설명해 보겠습니다.
먼저 FuncAnimation 클래스 생성자의 모습입니다.
class
matplotlib.animation.FuncAnimation(fig, func, frames=None,
init_func=None, fargs=None, save_count=None, *,
cache_frame_data=True, **kwargs)다음은 생성자 함수의 전달인자에 대한 설명입니다.
- fig : matplotlib.figure.Figure (Figure 객체)
- func : callable (매 프레임마다 호출되는 콜백 함수)
- frames : iterable, int, generator function, or None, optional (데이터 소스)
- init_func : callable, optional (첫 프레임 전 호출되는 초기화 함수)
- fargs : tuple or None, optional (콜백함수의 추가 전달 인자)
- save_count : int, optional (프레임의 캐시수)
- interval : number, optional (새로 그려질 매 프레임의 시간 간격)
- repeat_delay : number, optional (그리기가 반복될때 추가 지연)
- repeat : bool, optional (애니메이션 반복 여부)
- blit : bool, optional (화면의 최적화와 관련, 변경된 부분만 그리는 것으로 추정)
- cache_frame_data : bool, optional (프레임 데이터를 캐쉬해 대용량데이터에 도움)
이상이 FuncAnimation Class의 설명인데, 저는 초기화, 콜백 함수를 설정하고 간격은 약 100ms로 설정하였습니다.
이제 설정을 마치고 canvas.draw() 함수를 이용해 챠트를 그리고, self.show() 함수를 이용해 Qt Widget을 띄웁니다.
이제 45번 라인 initPlot() 함수가 호출되고 생성자에서 만들어둔 numpy 배열 self.y를 이용해 plot의 Y축을 초기화 합니다.
이 함수는 FuncAnimation 클래스 생성 시 inut_func로 등록해 둔 함수이며, 애니메이션 프레임을 갱신전 한번만 호출됩니다.
마지막으로 49번 라인 animate() 함수는 매 100ms 마다 호출되며, 챠트 Y축 값에 timeInterval (0.1) 을 더한 sin 그래프를 그려가게 됩니다.
이상으로 코드 분석을 마칩니다.
감사합니다.
- 개발 환경 : Windows 10 Pro, VS2017, Python3.7.2(64bit), PyQt5.13.2, matplotlib 3.1.1
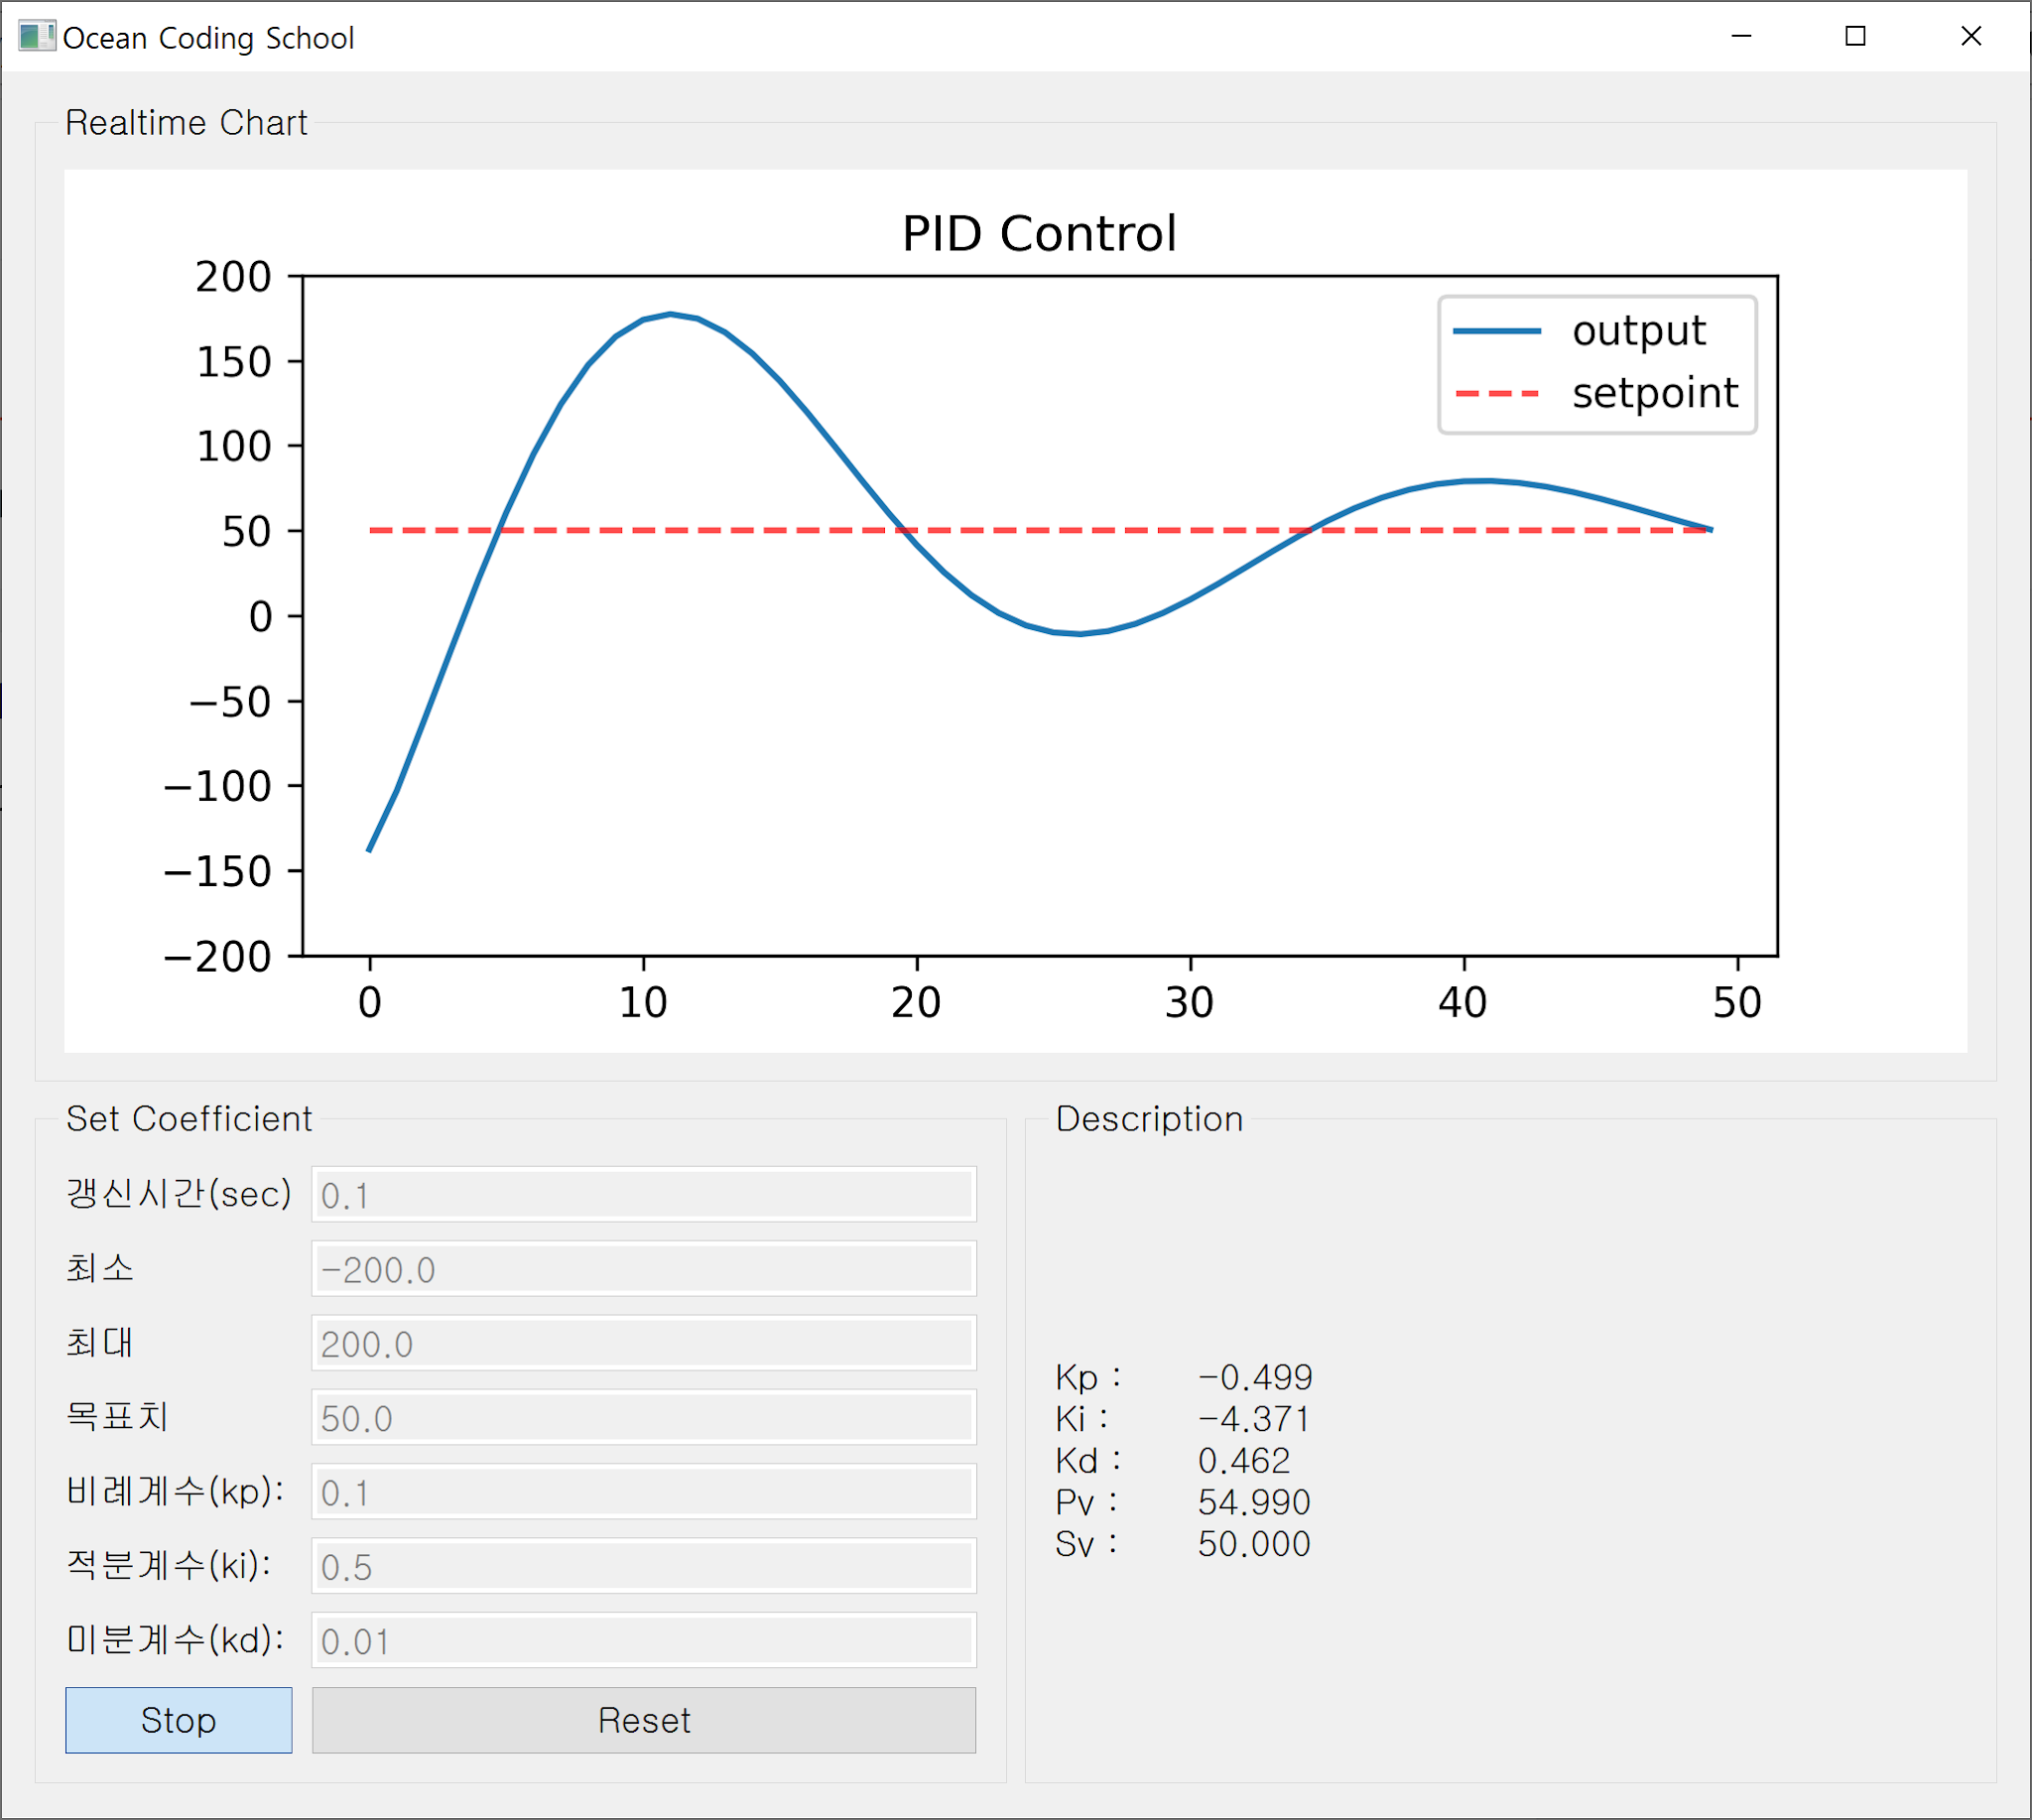
안녕하세요~ matplotlib으로 실시간 그래프 그리는 방법을 깔끔하게 정리해주셔서 많은 도움이 되었습니다.
답글삭제본 글을 참고하여 조작 창에서 실시간 그래프를 띄우는 프로그램 코드를 작성했습니다.
https://stella47.tistory.com/445
너무 도움 많이 되었습니다. 감사합니다~
네 감사합니다.
삭제